¿Has usado Matplotlib para Windows?
Análisis de Matplotlib
Contenido asistido por IA ·
No escrito por el personal de CNET.
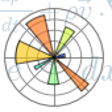
Matplotlib is a powerful plotting library designed for Python programming, allowing developers to create static, animated, and interactive visualizations in a wide variety of formats. It is particularly well-suited for data analysis and scientific computing, providing extensive support for 2D plotting, including line graphs, scatter plots, bar charts, and histograms. One of its key features is the ability to customize plots with various styles, colors, and annotations, making it a versatile tool for presenting data effectively.
Alternativa más recomendada

The library is built on top of NumPy and integrates seamlessly with other libraries such as Pandas and SciPy, allowing for efficient data manipulation and analysis. Matplotlib supports multiple output formats, including PNG, PDF, and SVG, enabling easy sharing and publication of visualizations. Its extensive documentation and active community support further enhance its usability, making it a popular choice among data scientists and developers looking to visualize complex datasets.
¿Has usado Matplotlib para Windows?
Explorar más

QtitanMultimedia
Versión de pruebaFile.Transfer ASP
Versión de pruebaVideoLab for FireMonkey
Versión de pruebaChartDirector for ASP/COM/VB
Versión de pruebaTeeChart Java for Android
Versión de pruebaSMS Server
Versión de pruebaCatalyst File Transfer .NET
Versión de prueba
2007 Microsoft Office System Update: Redistributable Primary Interop Assemblies
GratuitoActiveComport Serial Port Toolkit
Versión de prueba
Update for the IDirectPlay4 API of Microsoft for DirectX 9.0x (DirectPlay) (KB839643)
GratuitoPDF417 Decoder SDK/DLL
Versión de pruebaDuroBlend GUI Engine
Versión de prueba