¿Has usado Matplotlib (64-bit) para Windows?
Análisis de Matplotlib (64-bit)
Contenido asistido por IA ·
No escrito por el personal de CNET.
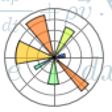
Matplotlib (64-bit) is a powerful plotting library for Python, designed to create static, animated, and interactive visualizations. It is widely used in data analysis and scientific computing, providing a flexible framework for generating high-quality graphs and charts. The library supports various output formats, including PNG, PDF, SVG, and more, making it suitable for a range of applications from academic research to professional data presentation.
Alternativa más recomendada

The library's versatility is evident in its ability to handle large datasets and produce complex visualizations while maintaining ease of use. With a large collection of built-in styles and customization options, users can tailor their plots to meet specific aesthetic requirements. Matplotlib is compatible with numerous Python environments, including Jupyter notebooks, making it accessible for both beginners and advanced users in the field of data science.
¿Has usado Matplotlib (64-bit) para Windows?
Explorar más

iConf.NET SDK
Versión de prueba
TMS IntraWeb Security System(Delphi XE2 and C++Builder XE2)
Versión de pruebaBCGControlBar Library Professional Edition
Versión de pruebaBarCodeWiz Barcode Control for Windows Forms
Versión de pruebaAsposeTextBox Web
Versión de prueba
Security Update for Exchange 2000 Server (KB894689)
Gratuito
Update for 2007 Microsoft Office System (KB932080)
GratuitoDataTableToPDF
Versión de pruebaTeeChart for Javascript
Versión de pruebaImageFX for Delphi 2009
Versión de pruebaSteware Gauges NET For WinForm
Versión de prueba
VisioForge Media Player SDK Delphi Lite
Gratuito